These organic compounds can cause challenges for the water treatment plant by increasing coagulant demand, causing taste and odor issues and increasing demand for disinfectants. Even when the organics themselves are not a health hazard, when combined with chlorine they may lead to the formation of harmful disinfection byproducts (DBPs). Reducing the concentration of organics via various treatment processes, such as enhanced coagulation and activated carbon adsorption, is one of the most effective ways to reduce DBP formation during the chlorination process. To better control the level of organics making it into the disinfection process and to optimize the treatment processes geared towards removing organics, frequent and rapid monitoring of their concentrations at various points along the treatment train is required.
The Challenge
TOC (total organic carbon) is an aggregate parameter that measures the concentration of all organics in terms of carbon. Therefore, monitoring TOC either in real time or frequently and in a rapid fashion is an important tool for making data driven decisions at a treatment plant. However, frequent TOC testing can be very expensive, and require significant time, labor and expertise. Conventional TOC analyzers come at a very high capital cost along with significant operating costs. When these costs are coupled with the maintenance requirements of the instrument, it becomes increasingly prohibitive for a plant to use conventional TOC analyzers for their monitoring needs.
The Solution
Real Tech’s portable TOC Field Meter is available at a cost that is orders of magnitude less than a typical conventional TOC analyzer and has virtually no operating costs associated with it. The field meter can be used to rapidly test multiple locations at a plant with absolutely no reagents required for the testing. As no additional cost is incurred per test and the testing time is less than a minute, samples can be taken as frequently as needed allowing for a spatiotemporally coherent sample set. Thus, better decisions can be made across the treatment plant optimizing treatment processes while reducing costs associated with consumables such as coagulants and polymers.
If it is deemed a specific monitoring location would benefit from continuous TOC analysis, Real Tech technology advancements are also available in real-time solutions that are more practical and significantly more affordable than conventional TOC analyzers.
The Results
A Missouri River Basin Water Authority acquired Real Tech’s TOC Field Meter to monitor TOC in four water treatment plants that rely on the Missouri River to provide drinking water to communities they serve.
At each plant, water samples from different locations, such as plant inlet, post GAC, pre-disinfection and post filtration, were tested.
This created a diverse sample set with not only variable TOC levels but also variable water backgrounds and compositions of organics, which further demonstrated the versatility of the meter. The regression analysis results are shown in Figure 1, where excellent agreement between the meter and the lab TOC values is achieved. In Figure 2, the model trending over the sample set is shown to better illustrate how much deviation there is between lab values and the meter values. Despite the highly variable backgrounds to the samples, the meter readings were on average within ±0.13 mg/L of the lab values across
a set of 14 samples. The Missouri River Basin Water Authority is now empowered to improve organics monitoring with speed, ease and confidence in the results to advance the management of their water.
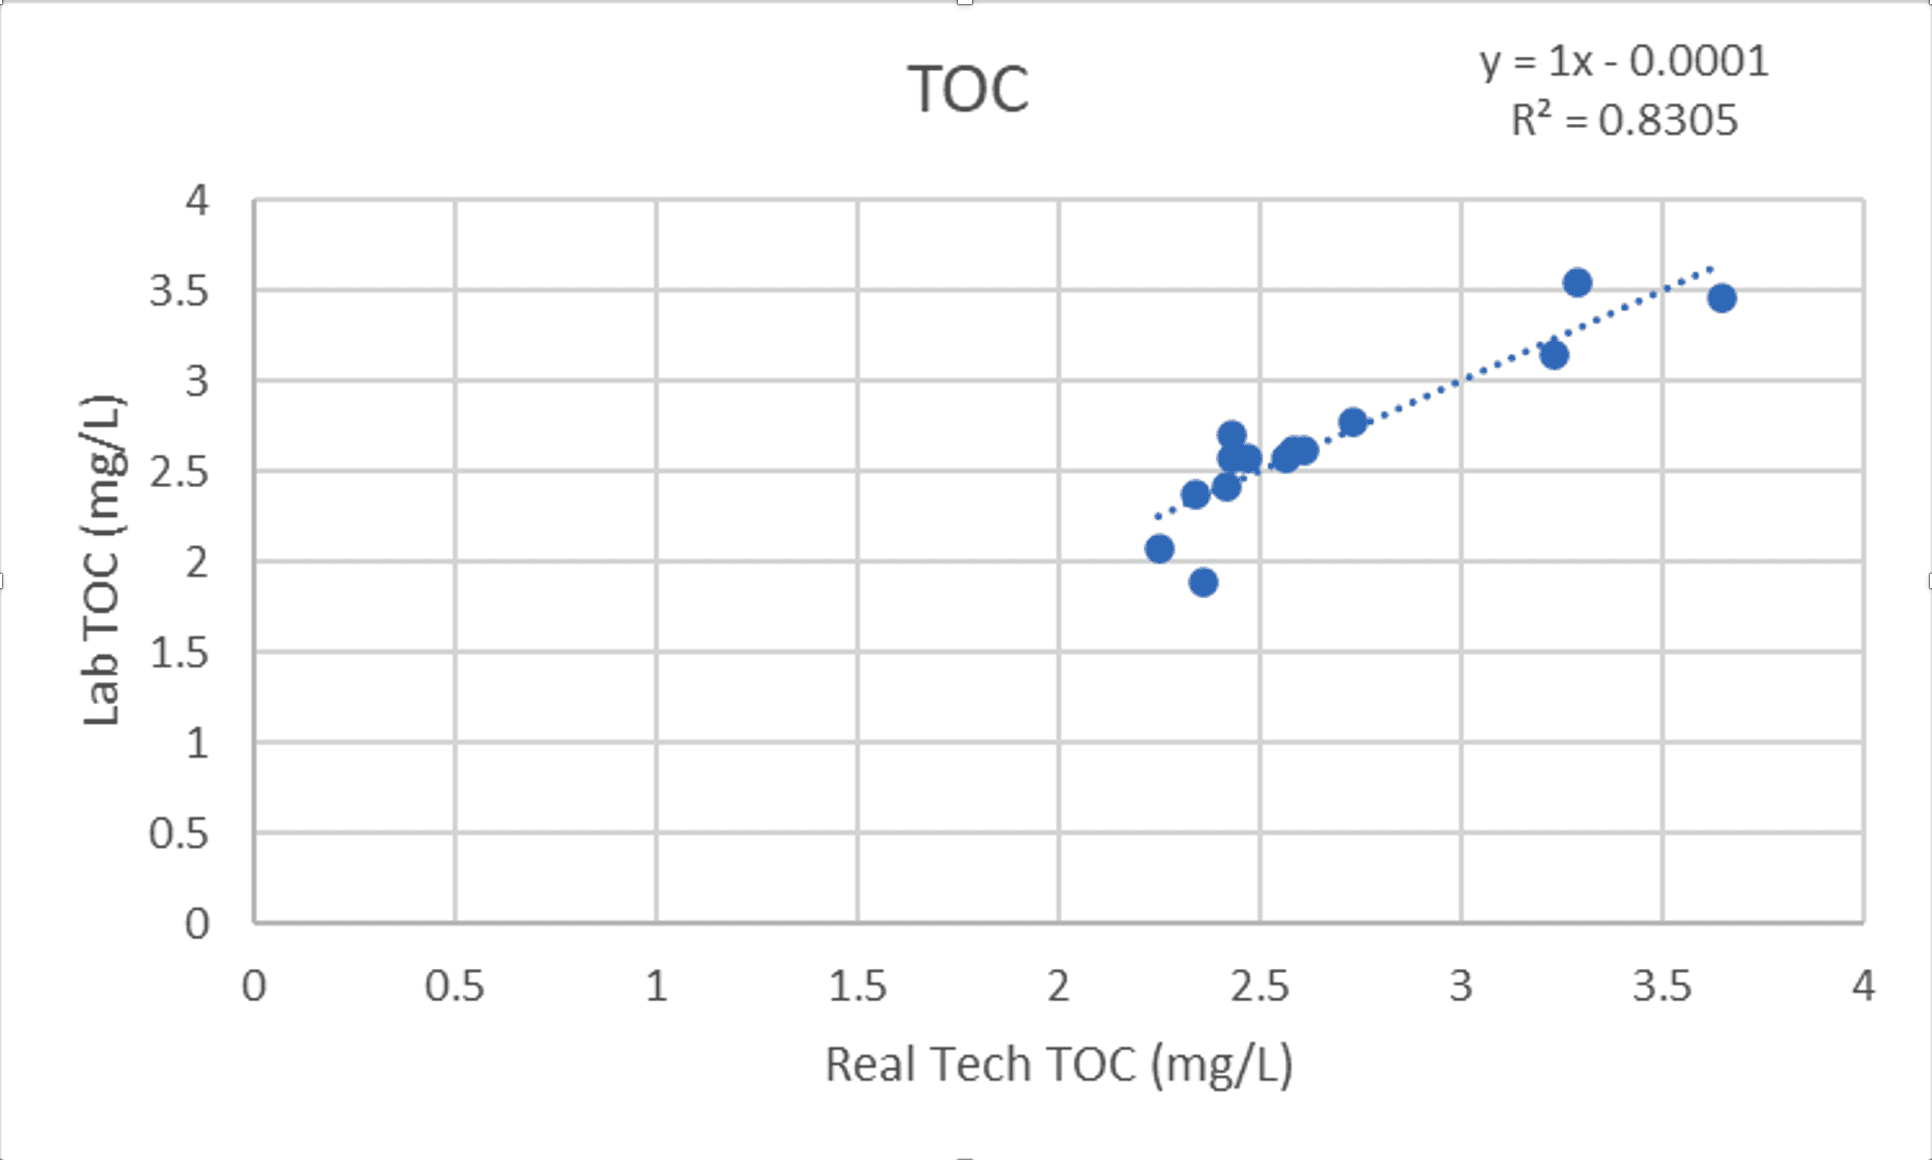
Figure 1 – Regression analysis between lab and field meter TOC readings.
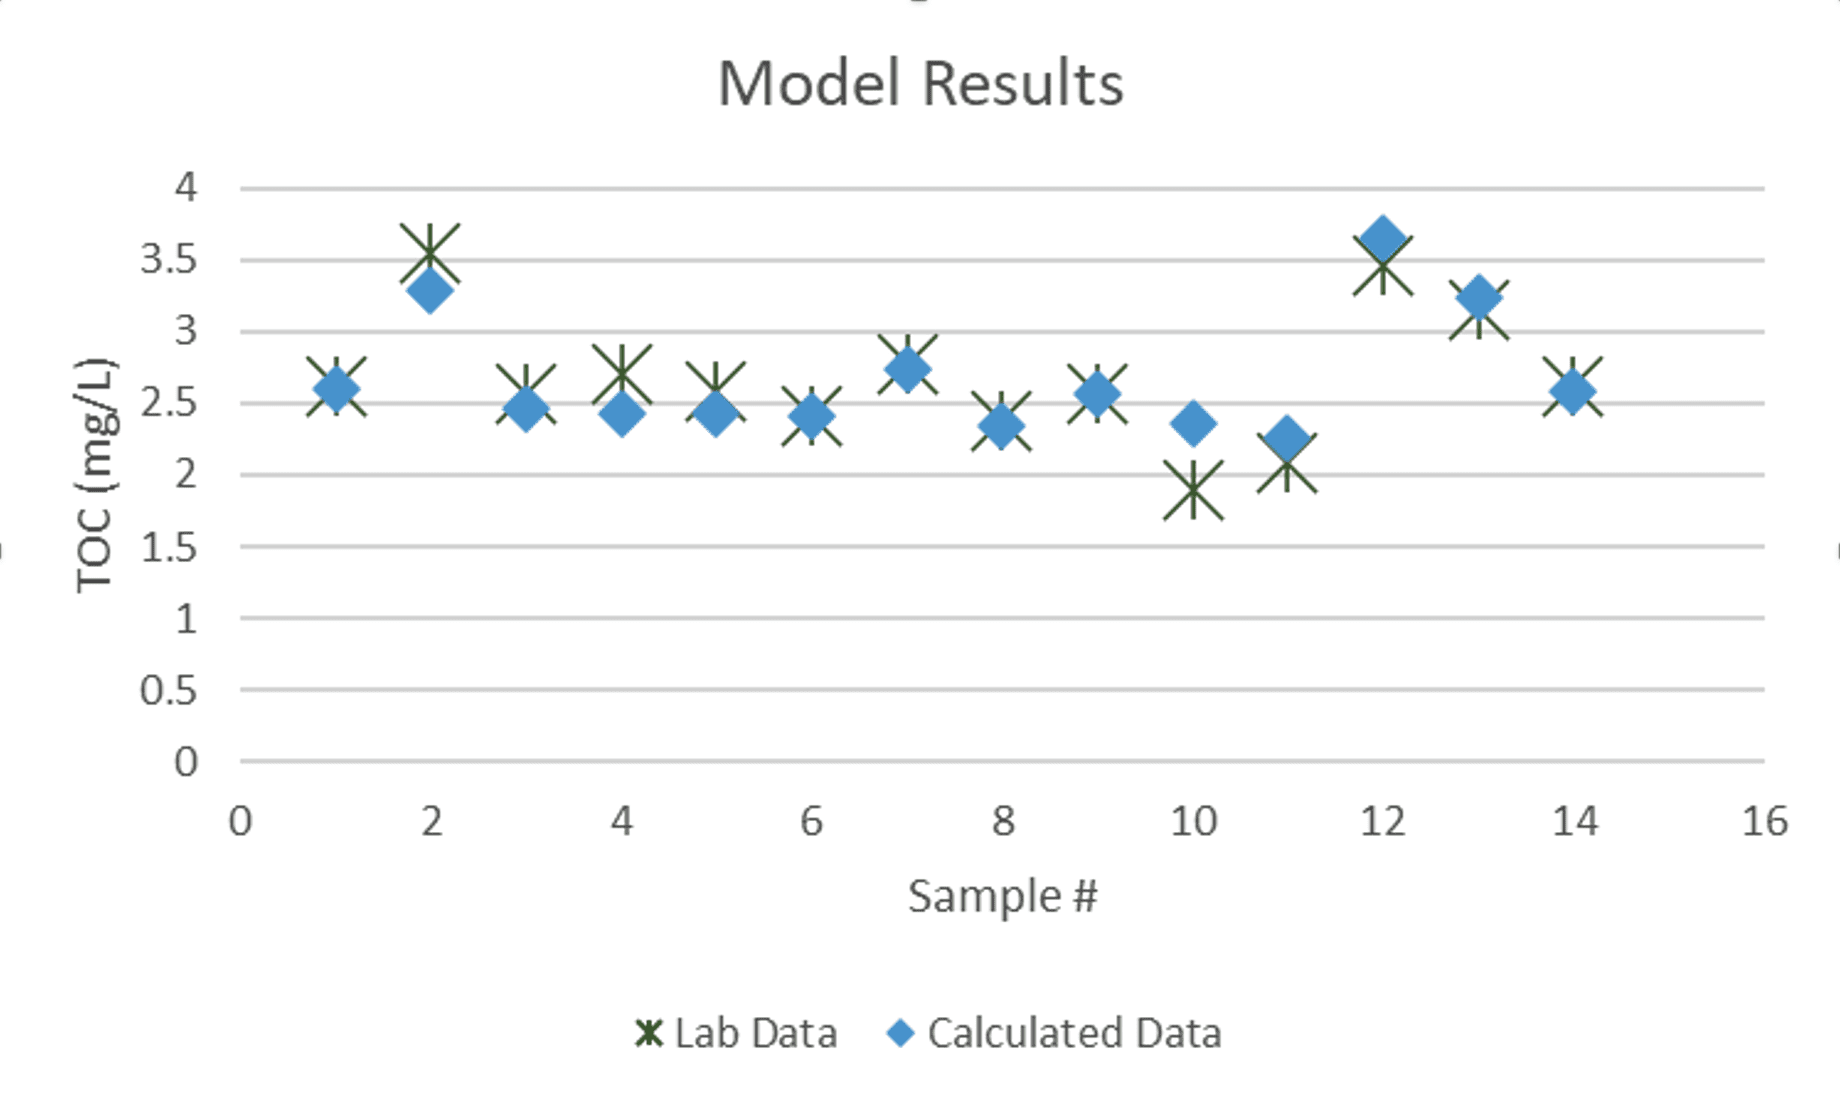
Figure 2 – Absolute error analysis between lab and field meter TOC readings.
Problems Solved
• Rapid and frequent TOC monitoring across treatment plants as well as at multiple locations along the treatment train
• Improved data collection for treatment performance analyses that was not possible with conventional TOC analyzers which are expensive, hard to maintain and hard to operate
• Data driven process control decisions to optimize TOC removal
• Better management of DBPs through reduced organics levels